Instream Flow Data
Water Resource Inventory Area (WRIA)
Find data for WRIAs with established instream flows using the pull-down menu above this map. Select gage stations / control points on the map or in the table below it for data and graphs comparing legal instream flow amounts to actual water levels for each station.
Note: Some of these focus sheets are still being developed. If you don’t see a link to information for the WRIA you’re looking for, check back soon.
USGS control points and Ecology gaging stations
About instream flows
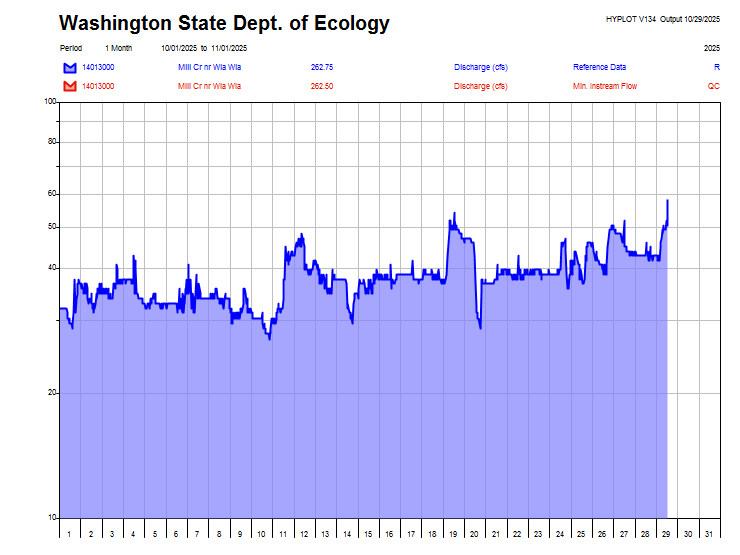
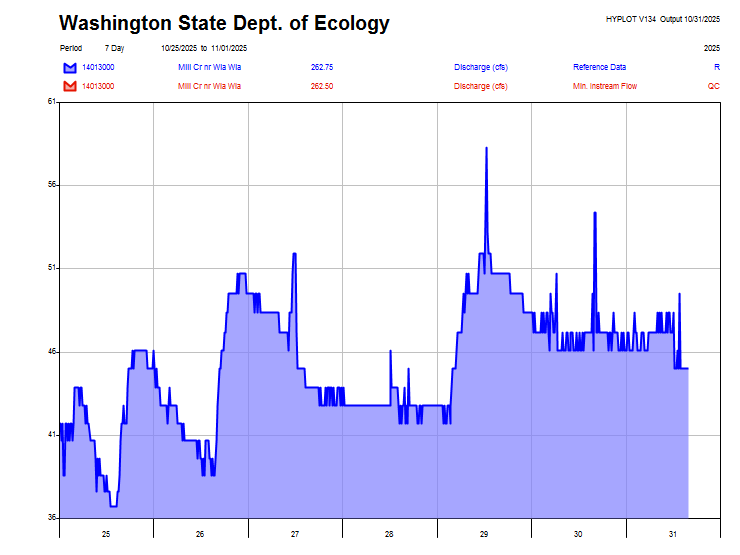
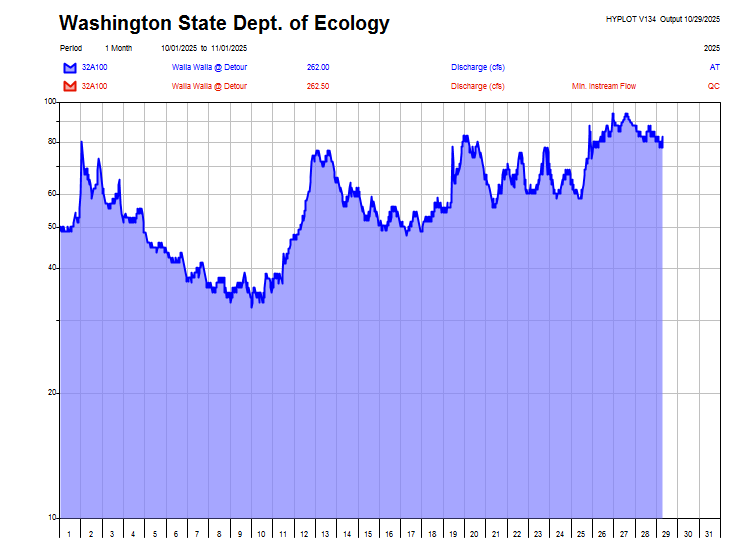
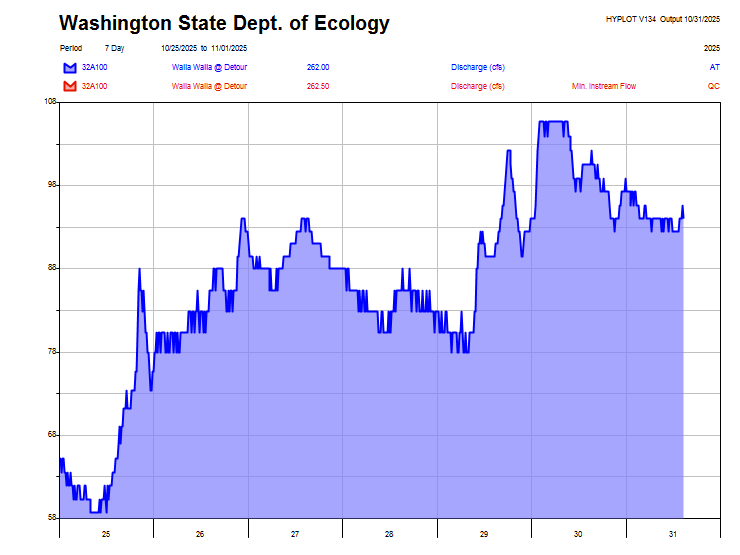
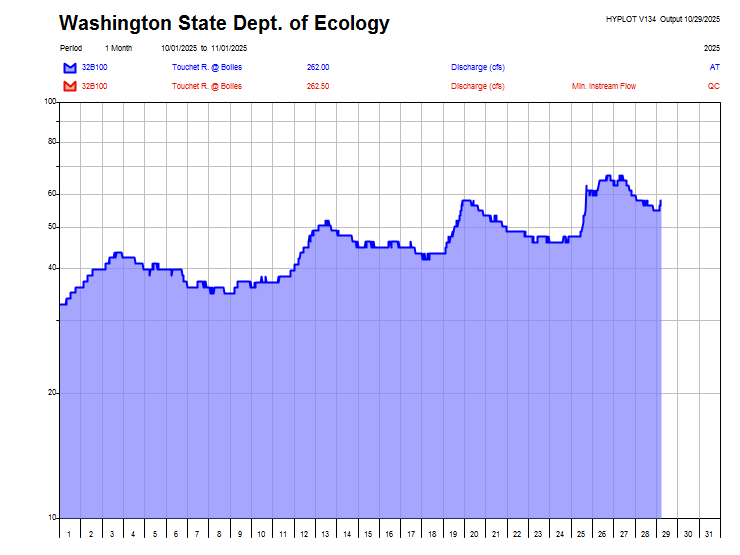
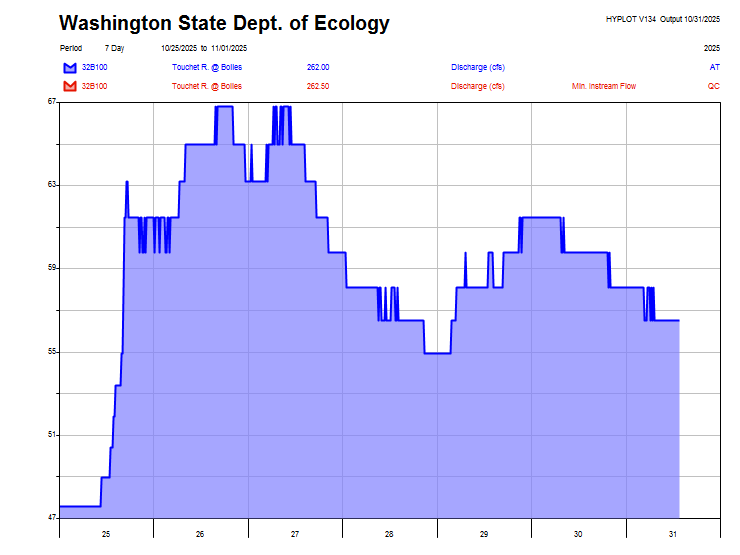
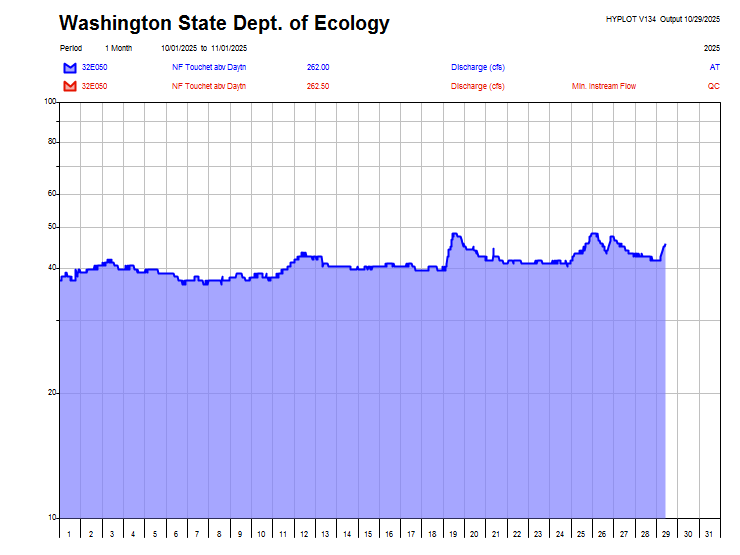
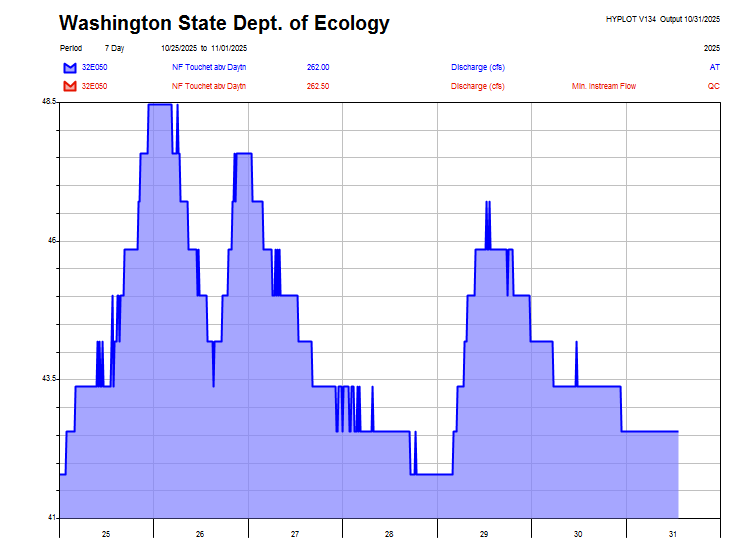
Instream flowsopen_in_new are an amount of water, established by rule and court decisions, in a given river or stream. They usually vary from month to month, since seasonal changes cause natural streamflow to vary. These graphs compare the legal instream flow amounts to actual water levels. When actual streamflows drop below the adopted instream flow levels, junior water rightsopen_in_new (those established after the instream flow) can be temporarily interrupted to keep the water in the stream.
In your watershedopen_in_new contains more information about all 62 Washington watersheds, also called WRIAs. See our lookup toolopen_in_new to find your WRIA.