|
Please select the completed DMR you would like to view:
|
|
|
Boatyard
|
The picture below shows what a typical completed monthly Boatyard DMR might look
like for one outfall if all samples are taken during the reporting period. Please
check for additional outfalls on your DMR screen.
|
Return to Top
|
Construction Stormwater - Less than 5 acres
|
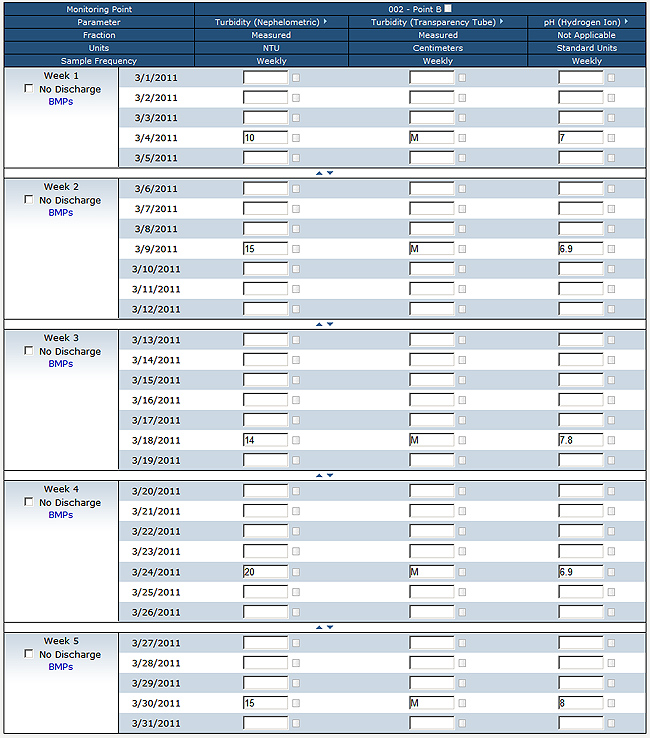
The picture below shows what a typical completed monthly Construction Stormwater
DMR should look for one outfall if all samples are taken during the reporting period.
'M' (Monitoring is conditional/not required) is used in the Turbidity (Transparency
Tube) column because the samples were processed using the Nephelometric method.
If you were to use the transparency tube test method, then the 'M' would be in the
Turbidity (Nephelometric) column. Please check for additional outfalls on your DMR
screen.
|
Return to Top
|
Construction Stormwater - 5 acres or more
|
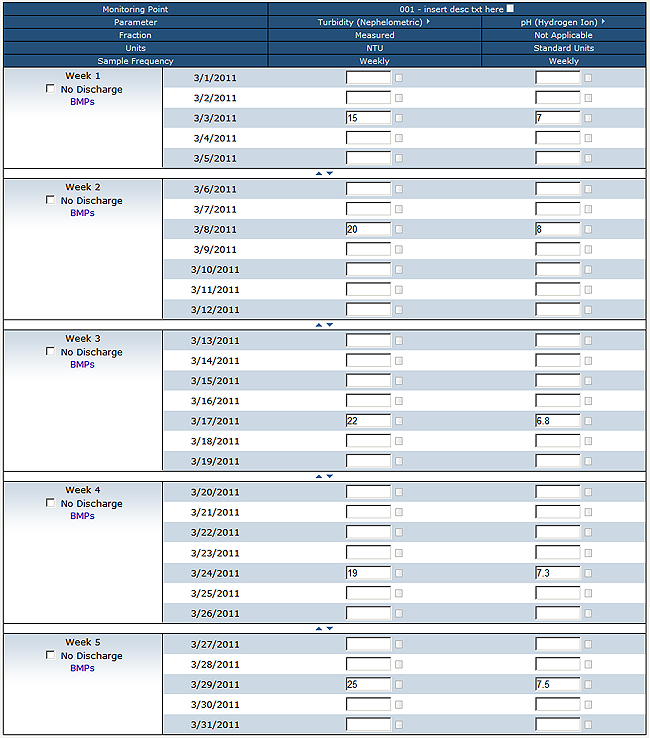
The picture below shows what a typical completed monthly Construction Stormwater
DMR should look for one outfall if all samples are taken during the reporting period.
Please check for additional outfalls on your DMR screen.
|
Return to Top
|
Construction Stormwater - One Week with No Discharge
|
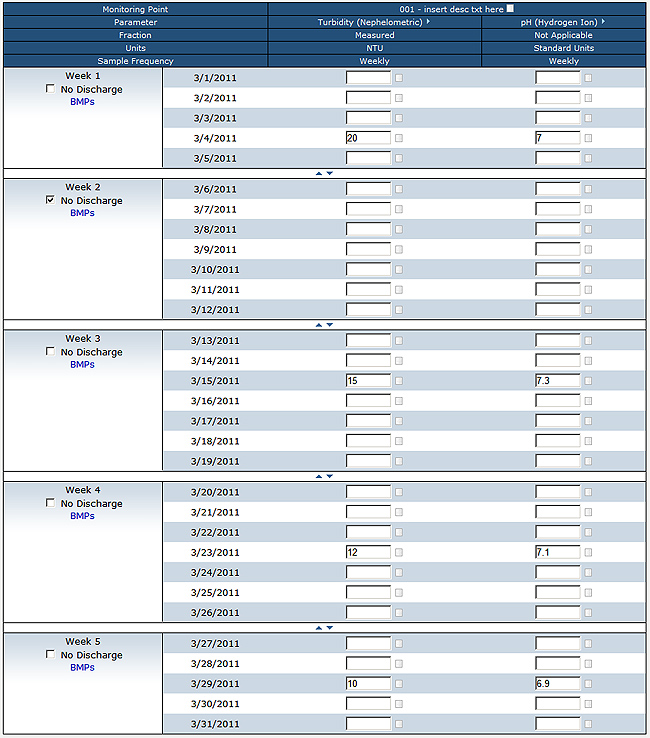
The picture below shows what a typical completed monthly Construction Stormwater
DMR should look for one outfall if one week had no discharge during the reporting
period. The DMR below has week two marked as no discharge using the check box on
the left had side. Please check for additional outfalls on your DMR screen.
|
Return to Top
|
Fruit Packer
|
The picture below shows what a typical completed annual Fruit Packer DMR should
look like for one outfall if all samples are taken during the reporting period,
plus some additional flow samples. Please check for additional outfalls on your
DMR screen.
|
Return to Top
|
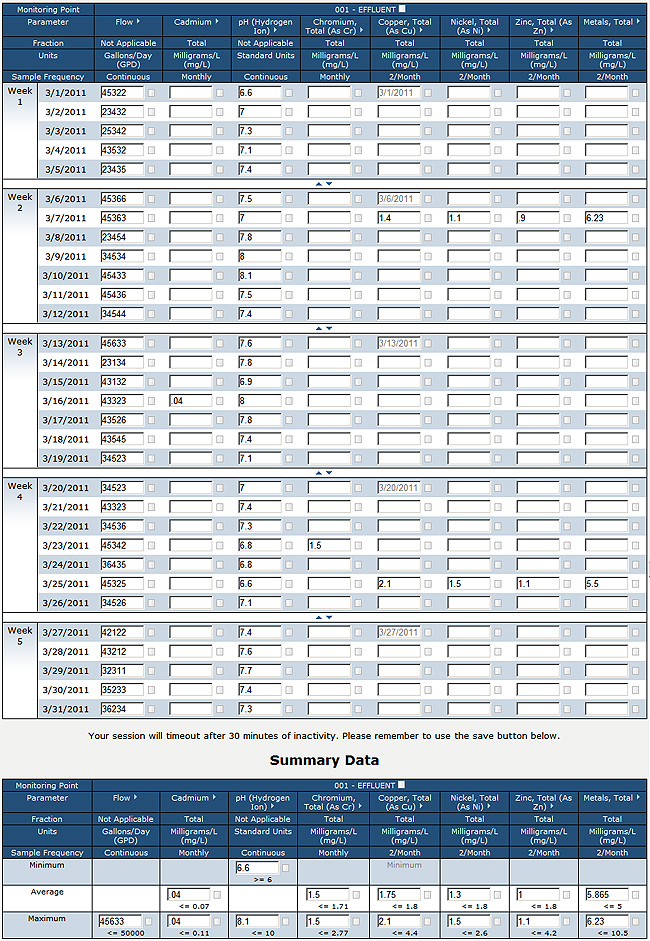
Industrial Individual
|
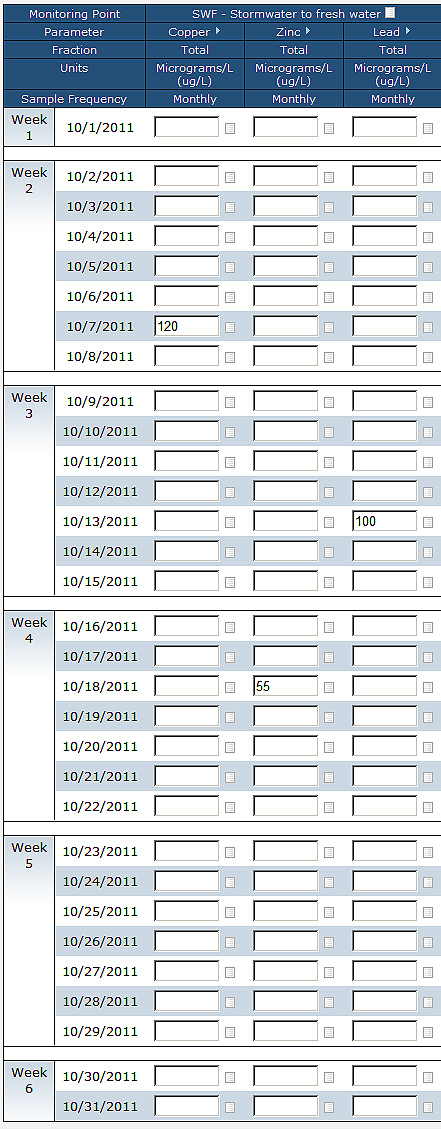
The picture below shows what a typical completed monthly Industrial DMR might look
like for one outfall if all samples are taken during the reporting period. Please
check for additional outfalls on your DMR screen.
|
Return to Top
|
Industrial Stormwater - One Sample
|
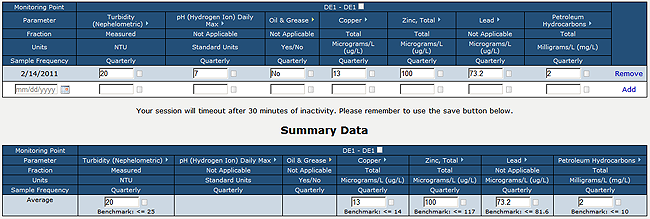
The picture below shows what a typical completed quarterly Industrial Stormwater
DMR should look like for one outfall if only one sample is taken during the reporting
period. If only one sample is taken, then WQWebDMR will automatically move the individual
values into the summary section for you. Please check for additional outfalls on
your DMR screen.
|
Return to Top
|
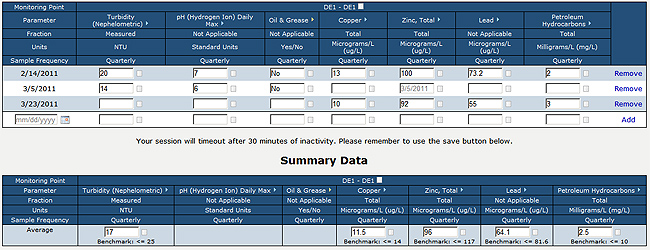
Industrial Stormwater - More than one Sample
|
The picture below shows what a typical completed quarterly Industrial Stormwater
DMR should look like for one outfall if more than one sample is taken during the
reporting period. If only one sample is taken for a parameter, then WQWebDMR will
automatically move the individual values into the summary section for you. If not,
then you will need to calculate the average and put the value into the summary section.
Please check for additional outfalls on your DMR screen.
|
Return to Top
|
General Municipal
|
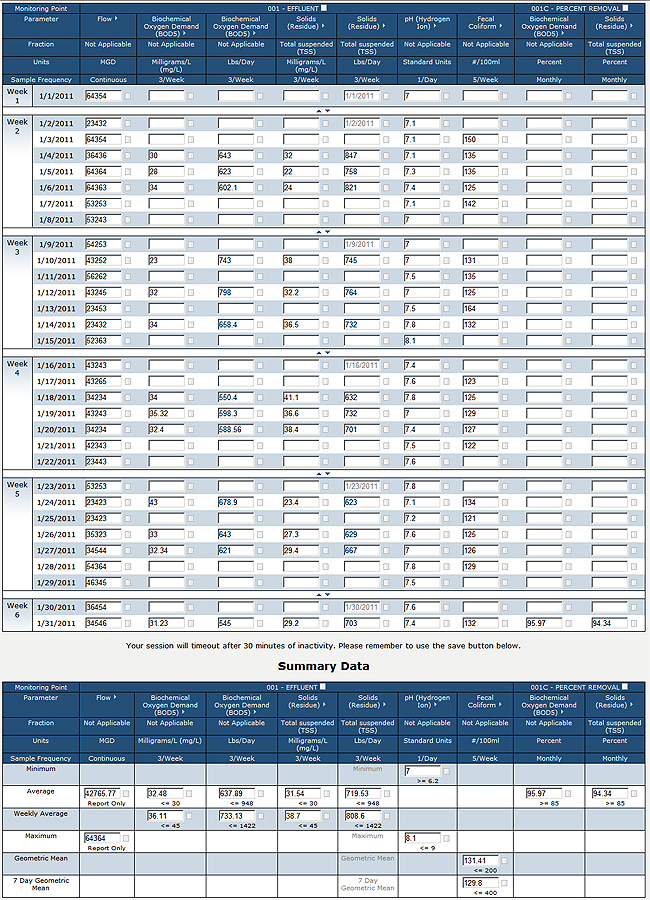
The picture below shows what a typical completed monthly Municipal DMR might look
like for one outfall if all samples are taken during the reporting period. Please
check for additional outfalls on your DMR screen.
|
Return to Top
|
Municipal that uses UV
|
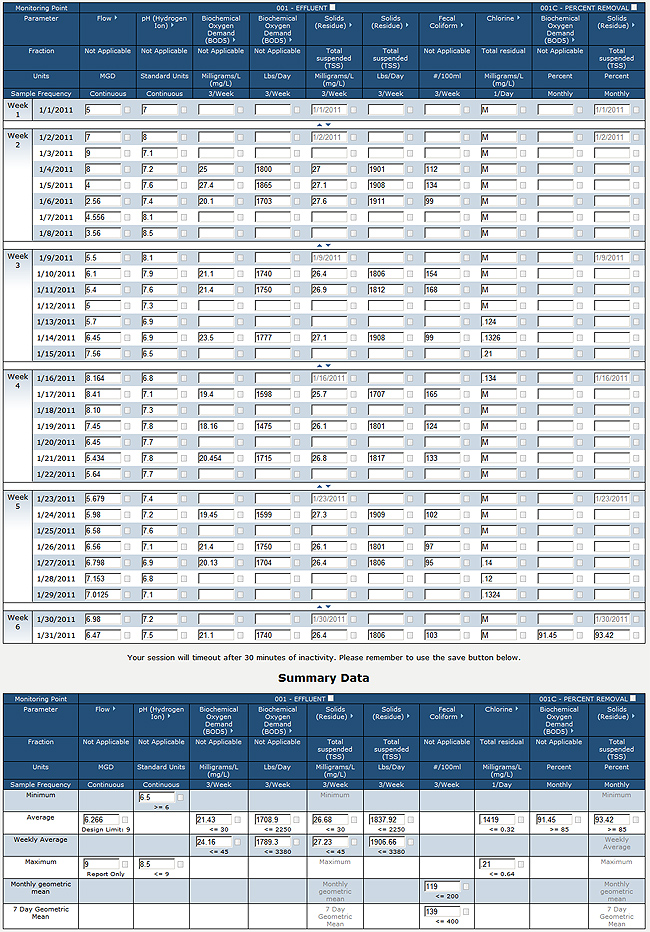
The picture below shows what a typical completed monthly Municipal DMR might look
like for a facility that uses UV treatment if all samples are taken during the reporting
period. 'M' (Monitoring is conditional/not required) is used in the Chlorine column
because chlorine was not used for the whole month. Since chlorine is required to
be sampled 1/Day (sampling frequency), you need to report that sampling was not
required because the facility did not use chlorine every day. Please check for additional
outfalls on your DMR screen.
|
Return to Top
|
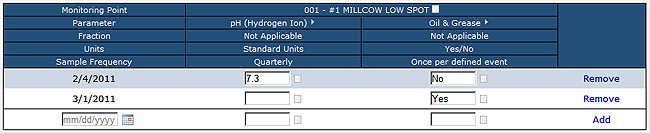
Sand and Gravel - Surface Water Discharge
|
The picture below shows what a typical completed quarterly Sand and Gravel DMR should
look like for one surface water outfall. Please check for additional outfalls on
your DMR screen.
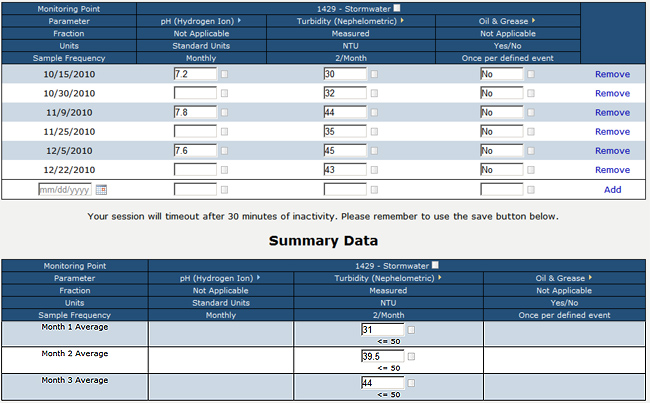
If your facility discharges some, but not all, of the months during the monitoring period, enter two dates with the C (no discharge) code in each month without discharge.
|
Return to Top
|
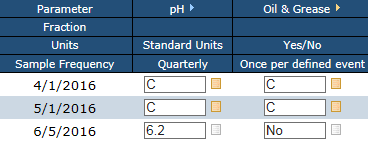
Sand and Gravel - Groundwater Discharge
|
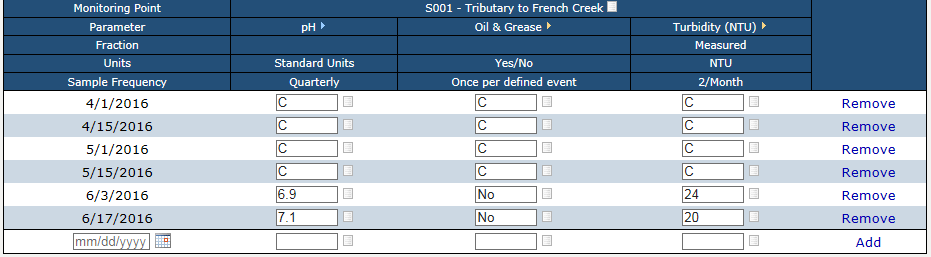
The picture below shows what a typical completed quarterly Sand and Gravel DMR should
look like for one groundwater outfall. Please check for additional outfalls on your
DMR screen.
If your facility discharges some, but not all, of the months during the monitoring period, enter one date with the C (no discharge) code in each month without discharge.
|
Return to Top
|
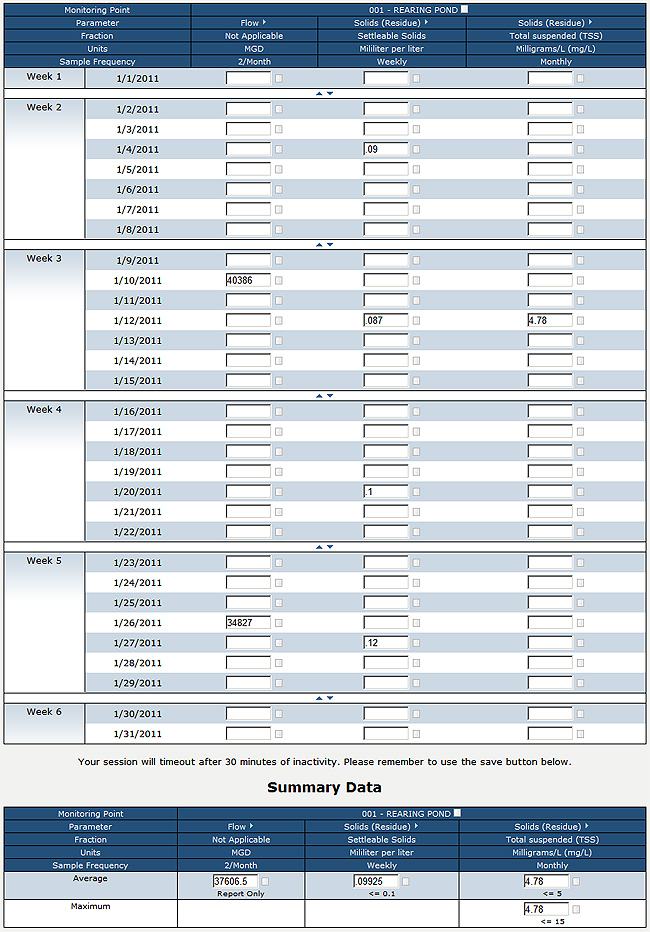
Upland Fish Hatchery
|
The picture below shows what a typical completed monthly Upland Fish Hatchery DMR
should look like for one outfall. Please check for additional outfalls on your DMR
screen.
|
Return to Top
|
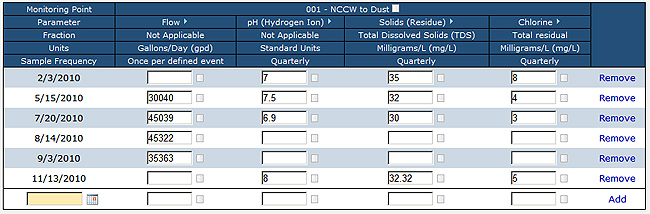
Water Treatment Plant
|
The picture below shows what a typical completed monthly Water Treatment DMR might
look like for one outfall if all samples are taken during the reporting period.
Please check for additional outfalls on your DMR screen.

|
Return to Top
|
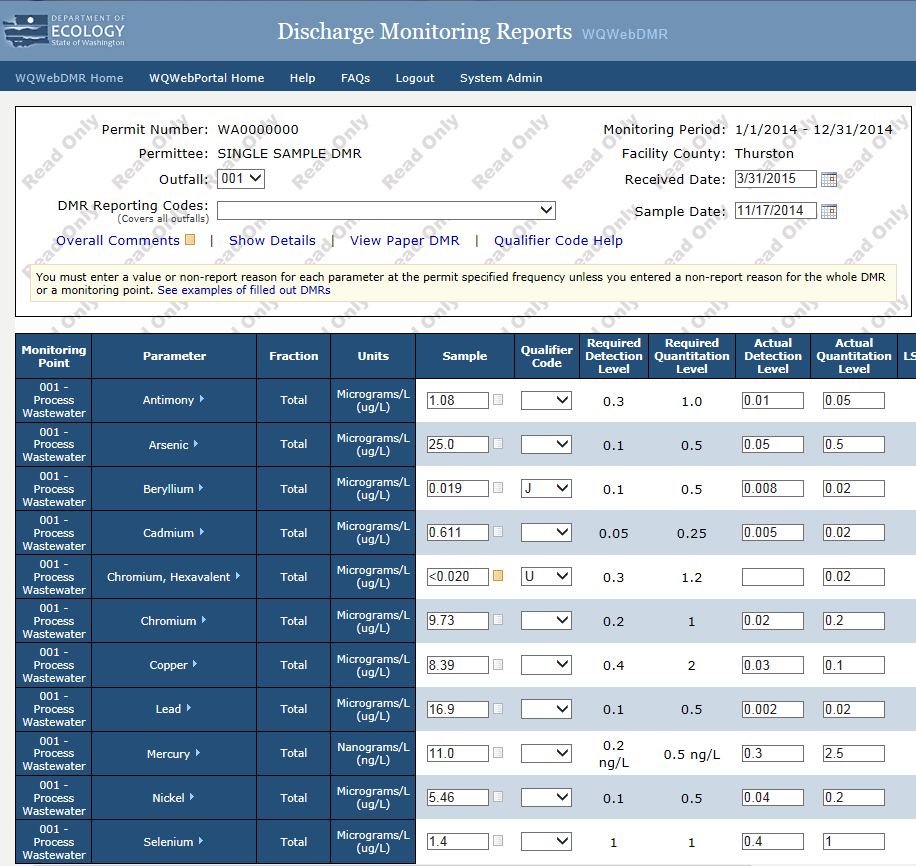
Single Sample DMR |
The picture below shows a row of a Single Sample DMR. Please enter all information for
each parameter tested from your lab report. Here is a description of the qualifier codes.
|
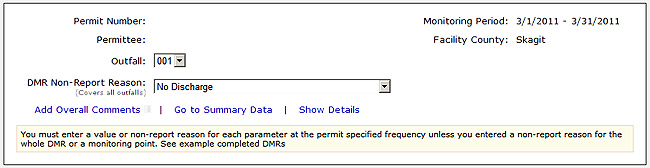
No Discharge (whole DMR)
|
The picture below shows what a typical completed no discharge DMR might look like
for all outfalls during a reporting period. No additional data is needed in the
data entry section.
Construction Stormwater DMRs - BMPs are still required for each monitoring point.
|
Return to Top
|
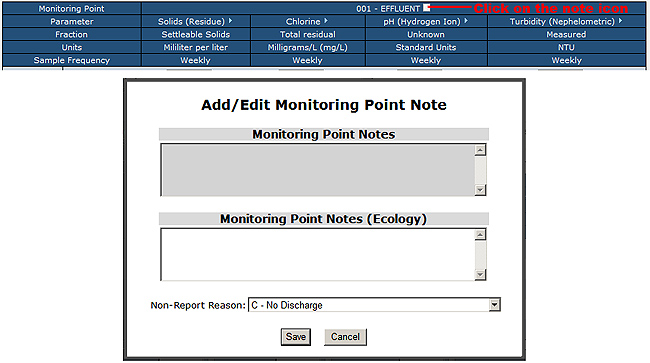
No Discharge (Monitoring Point)
|
The picture below shows what a typical completed no discharge DMR might look like
for one monitoring point during a reporting period. No additional data is needed
in the data entry section for the no discharge monitoring point.
Construction Stormwater DMRs - BMPs are still required for a no discharge monitoring
point.
|
Return to Top
|